

Books
A DEEP LEARNING APPROACH TO FAULT DETECTION AND CLASSIFICATION IN DATACENTERS.
Beltus Nkwawir Wiysobunri
Instanbul Technical University
Maslak, 34467 Saryer/stanbul
Assis. Prof. Hamza Salih Erden
Instanbul Technical University
Maslak, 34467 Saryer/stanbul
nkwawir18@itu.edu.tr erdenh@itu.edu.tr
Abstract
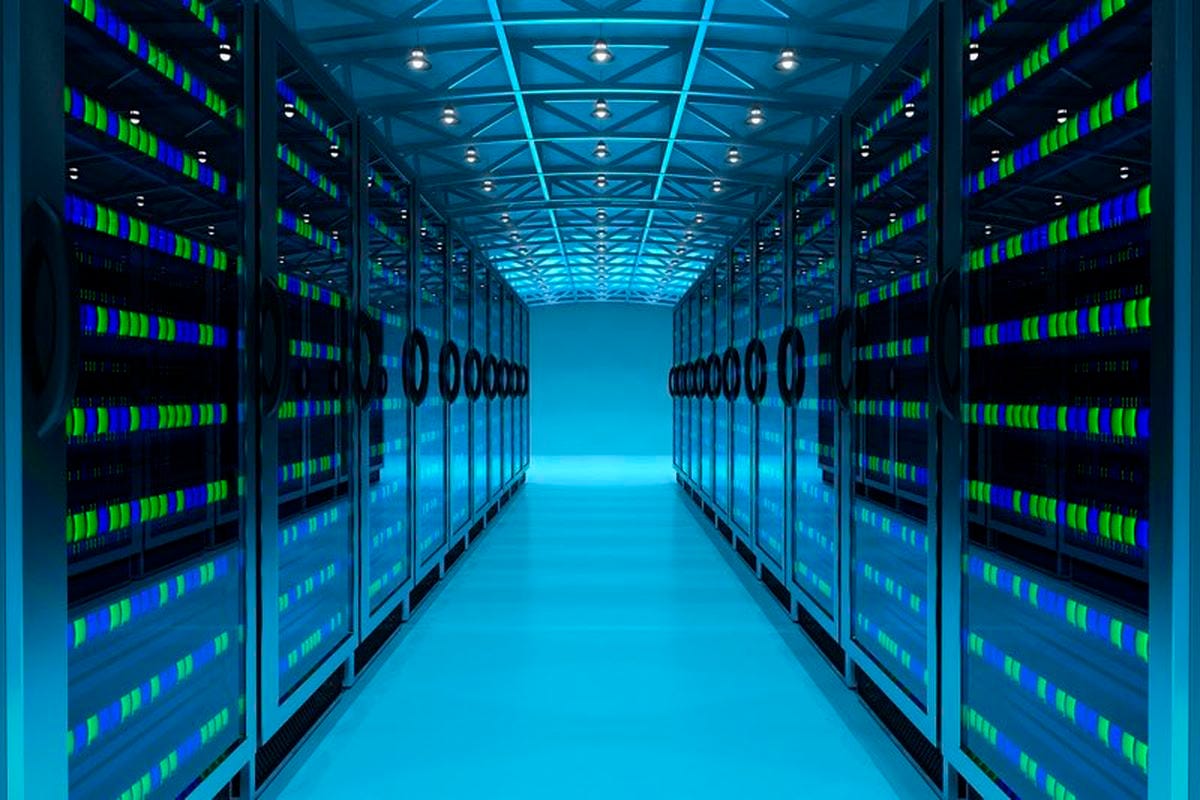
As cloud computing applications have witnessed an exponential growth in recent years, the maintenance of server uptime has never been more important. A fault in a server due to overload, attack, or a misconfiguration of a cooling system can be of imponderable economic and financial loss to the echelons of global institutions. The advent of thermal cameras has helped to provide fine texture information which can be used for monitoring and providing intelligent thermal management in large data centers. This paper focuses on leveraging the power and effectiveness of modern deep learning techniques for the classification, detection, and diagnosis of faults in datacenters using infrared images.
1. Introduction — Problem Statement\
Over the past few years, the world has witnessed a tremendous increase in cloud computing and its applications that have resulted in an exponential growth in the number of servers in data centers. As a consequence, there has been almost a linearly proportional increase in the rate of energy consumption by these data centers which has led to an increasing overload in the CPUs of the servers. Given the dependence of some critical and multimillion institutions such as banking and health sector, failure of a server can be of catastrophic economic and financial loss to such Enterprises. Hence, the need for an efficient method for thermal fault diagnosis and detection in these centers using techniques such as image processing, machine learning, and deep learning algorithms. In addition, the growing importance, large scale, and high server density of high-performance computing data centers make them prone to attacks, misconfigurations, and failures (of the cooling as well as of the computing infrastructure). Such unexpected events often lead to thermal anomalies hotspots, fugues, and coldspots[4].
The complexity associated with the internal structure of data centers coupled with the variability of heat flow results in uneven temperature distribution inside a data center which further generates hotspots and coldspots. Some research on monitoring hotspots for data centers has been performed based on the use of traditional thermometers and thermal cameras [1–3]. However, a traditional thermometer can measure temperature only at a given point; therefore, the spatial resolution of the measurement domain obtained by deploying many thermometers is too low to successfully analyze hotspots. Hence the use of an infrared imager as a field sensor for monitoring servers can be employed to remedy these drawbacks. Infrared thermal imagers offer a variety of advantages some of which include: anti-electromagnetic interference, non-contact and non-destructive characteristics, high timeliness, and high accuracy. Furthermore, the temperature is a critically important indicator of proper operation hence it is reasonable to implement an infrared thermal imager as a tool for monitoring the state of servers in a datacenter. With the advent of more efficient image processing and machine learning algorithms in recent years, many high-performance datacenters are incorporating infrared thermal imaging techniques for real-time monitoring and analysis of the state of the server. Unfortunately, there exists a significant challenge in processing the thermal images and obtaining accurate temperature information which can then be passed up the pipeline for further analysis and finally decision making. Due to the low resolution of thermal images, the accuracy achieved in identifying faults in datacenters is quite low. This opens up the need to develop sophisticated image processing algorithms for feature extraction which will significantly reduce misclassification error. Hotspots in datacenters emanate from multiple sources. The cardinal causes of these hotspots are weak cooling systems, device faults, continuous overload, and attacks on the cooling systems. The existence of hotspots may cause server failures and reduce the cooling efficiency. Thus, minimizing the formation of hotspots is of extreme importance to data center operators.
Compared with normal RGB images, thermal images have the disadvantages of low overall gray levels, low signal-to-noise ratio, and low contrast. Therefore, it is often necessary to process thermal images before applying any recognition techniques.
1.1. Hypothesis and Paper Contribution\
The authors of [4] and the original producers of the dataset used in this work, struggled with the fact that thermal images have a low overall gray level, low signal to noise, and low contrast. Hence they spend a significant amount of time, preprocessing these thermal images and extracting different features such as statistical features, texture features, and morphological features while testing their individual and collective performance against an SVM classifier. This is quite a time-consuming task. Currently, deep Convolutional Neural Networks (CNNs) are considered one of the most widely used machine learn-
ing techniques. This is due to the fact that CNNs have the capabilities of hierarchical learning, automatic feature extraction, multi-tasking, and weight sharing[11]. In addition, deep CNNs can learn representations from grid-like data and research has shown a significant performance boost in diverse ML and Computer vision tasks such as Image Classification and Segmentation, Object Detection, Video Processing, Natural Language Processing, and Speech Recognition. This paper aims at completely annihilating the time-
consuming handcrafted and manual feature extraction steps used in [4,5,7,14] while improving the classification accuracy by leveraging the ability of deep CNNs to automatically learn low, mid, and high-level features. Our method will also go a long way to save a substantial amount of
time for data preprocessing and manual feature extraction of low-level features from the thermal images as performed in [4,5,7,14]
2. Further Literature Review\
In [5], three feature extraction algorithms are applied to segmented thermal images, namely the texture feature extraction algorithm, Hu moments feature extraction algorithm, and modified entropy feature extraction algorithm. Another common feature extraction technique applied in [6] is the calculation of the maximum temperature difference between the hotspot and its adjacent region, which is normally assigned as the reference region.
In [4], homomorphic filtering enhancement was applied to Infrared thermal images. The images were subjected to a one-dimensional maximum entropy segmentation to obtain server hotspot images; finally, morphological features, texture features, and statistical features are extracted from hotspot images; The authors in [7] selected regions of interest from the thermal images and then using these ROIs, they successfully extracted five(5) different features that included: Energy, Hotspot size, skewness, kurtosis, and entropy. Since most of the captured infrared images are presented in grayscale values; they do not show the actual temperature values. Therefore, if we want to get the real temperature values we should compute it from each grayscale pixel
intensity using the relation between the grayscale intensity and the actual temperature, Tr for each image pixel shown below
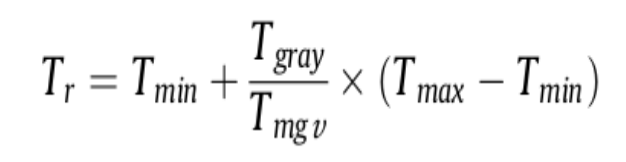
where the values of Tmax and Tmin are representing the temperature range of the image. Tgray is the pixel intensity value at a certain point in the grayscale image while Tmgv is the highest grayscale value of the image[6].
After the feature extraction step, [4, 5] used the machine learning SVM classifier to detect and classify server faults with accuracies of approximately 91%.
2. Proposed Method\
The proposed method used in this paper leverages state-of-the-art deep learning techniques that are capable of extracting low, mid and high-level features from spatial data such as IR images to perform amazing tasks such as detection and classification, which is the objective of this paper. Our solution involved the implementation and experimentation of 3 main steps.
1.Build a Deep Convolutional Neural Network 2. Imple-
ment Transfer Learning 3. Data Augmentation
2.1. Build a Deep Convolutional Neural Network
CNN is a concept that saw the spotlight through the work of LeCun in 1989 for processing grid-like topological data such as images and time-series data. The topology of CNN is divided into multiple learning stages composed of a combination of the convolutional layers, non-linear processing units, and subsampling layers as shown in the figure below
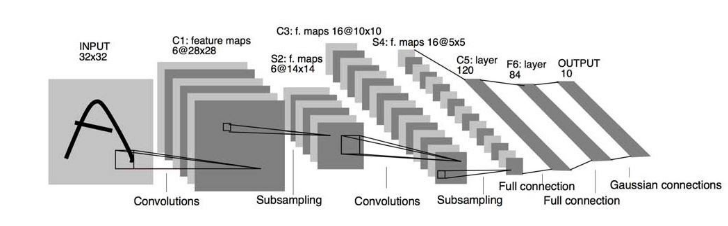
Figure 1: Image of a typical CNN architecture.
2.1.1 Convolutional Layer
The convolutional layer is composed of a set of convolutional kernels where each neuron acts as a kernel. However, if the kernel is symmetric, the convolution operation becomes a correlation operation[12]. Convolutional kernel works by dividing the image into small slices, commonly known as receptive fields. The division of an image into small blocks facilitates extracting feature motifs. Mathematically, the convolution operation can be expressed as shown below:
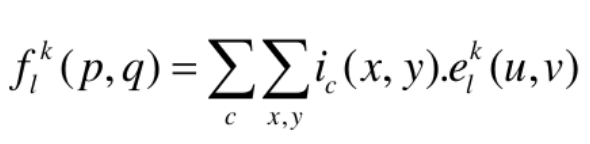
where, ic(x,y) is an element of the input image tensor Ic, which is element-wise multiplied by e kl (u,v) index of the kth convolutional kernel.
2.1.2 Pooling Layer\
Pooling or down-sampling is an interesting local operation. It sums up similar information in the neighborhood of the receptive field and outputs the dominant response within this local region[13]. The primary objective of the pooling operation is to extract a combination of features, that are invariant to translational shifts and small distortions and also to reduce the size of feature-map.
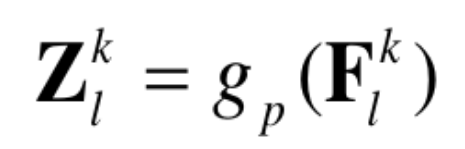
The above equation shows the pooling operation in which Z l k represents the pooled feature-map k of lth layer for kth input feature-map F l , whereas g p (.) defines the type of pooling operation.
2.1.3 Activation Function\
Activation function serves as a decision function and helps in the learning of intricate patterns. Researchers have developed several activation functions such as sigmoid, tanh, maxout, SWISH, ReLU, and variants of ReLU, such as leaky ReLU, ELU, and PReLU are used to inculcate non-linear combination of features. However, for this paper, we decided to implement the ReLu activation function.
###
2.2. Transfer Learning
Transfer learning is the improvement of learning a new task through the transfer of knowledge from a related task that has already been learned.
Due to the fact that our dataset is quite small (1350 images), we decided to leverage the relative performance improvement offered by transfer learning in this project. We used the pre-trained weight of MobileNet V2 which is a family of neural network architectures for efficient on-device image classification and related tasks. More information regarding MobileNetV2 can be found in [14]. MobileNet is well suited even for mobile devices and easy to deploy.
2.3. Data Augmentation\
Data augmentation is a strategy that enables practitioners to significantly increase the diversity of data available for training models, without actually collecting new data. Data augmentation techniques such as cropping, padding, and horizontal flipping are commonly used to train large neural networks. The small dataset of 1350 images motivated the use of data augmentation in this project. We implemented four data augmentation strategies. First, we randomly rotated the images in the range 0 to 180degrees. Then, we randomly shifted the images horizontally by a fraction of the width and then vertically by a fraction of the total height. Lastly, a horizontal flip was performed to mark the end of the augmentation process.
2.4. Dataset Acquisition
The dataset used in this research paper is obtained by sending an email request to the main authors of [4, 5] who were the creators and proprietary owners of the dataset. We were fortunate, Hang Liu — the main author of the papers honored our request and granted us the dataset. Without that this work would not have been possible. According to the [4, 5], the equipment and equipment setup used to collect the thermal images is as follows. The experimental equipment employed in the study included a server, a cabinet, monitors, a keyboard, a mouse, a thermal imager, a digital hygrometer, and a fixed bracket. The thermal imager and server were the main experiment equipment and are shown in Fig. 2. In the simulation experiment, the monitor, the keyboard, and the mouse were connected. A pre-loaded program was used to control the running load of the 16 CPUs of the server and the hard disk to simulate the running status of the server. Then, the thermal imager was fixed to the bracket and adjusted to the position of the server
in the thermal imager viewfinder. The thermal imager is used to collect data in the experiment. The emissivity was chosen according to the server and cabinet material. According to five different operating states of the server
(SX, OH, MF, CF, EB) and three different image acquisition schemes ( Scheme 1, Scheme 2, and Scheme 3), 1350 thermal images were collected as can be seen in Fig 2. SX represents 60% CPU load, OH represents 100% CPU load, MF represents Main Failure, CF represents CPU fan failure, and finally EB represents Block at the entrance of the server. For each of the schemes, approximately 90 thermal images for each of the five operating states of the server were collected.
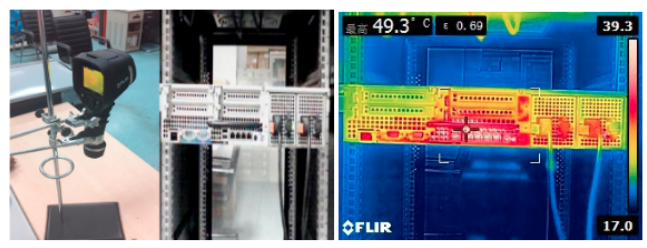
Figure 2: (Left) Thermal Imager and Server Outlet. (Right)
Original thermal image.
2.5 Experimental Results
2.5.1 Dataset
The experimental setup used to capture the IR images is explained by the original authors and proprietary owners of the dataset in [4]. Based on three different schemes, the authors recorded 1350 thermal images of the servers operating in five different conditions(SX, OH , MF , CF , EB) This dataset was then used to build, train and test a deep CNN model. However, before the training phase, some preprocessing steps were performed.
####
2.5.2 Thermal Image Preprocessing
As can be seen in Figure 2(right), the information regarding the thermal distribution on the surface of the servers is concentrated around a small rectangular section of the entire original image. By reading the images into python jupyter notebook, thermal images were cropped to a size of
(65 X 295) pixels as shown in the figure below.
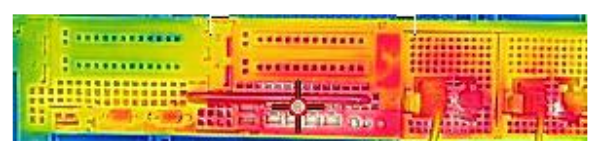
Figure 3: Cropped thermal Image (65 X 295)
2.6. Model Training\
Training a deep neural network model is a very computationally heavy task that requires a faster GPU module that I didn’t have on my personal PC. Fortunately, Google Drive provides free and powerful cloud-accessible GPU through the use of google collabs notebooks. By combining all the images from the three schemes belonging to the five different server operating states (SX, OH, MF, CF. EB) into a single training dataset folder, a new google collabs notebook for which the entire directory files was uploaded to google drive for accessibility by the notebook was created. For the training phase, the dataset was split into a training and validation set using TensorFlow Keras ImageDataGenerator. The training set was made of 1180 thermal images
and the validation set was made up of 170 thermal images belonging to the five classes. A link to the entire dataset is included at the end of this paper. The training and experimentation involved two phases. All the models imple-
mented in both phases was done using python programming language on google collabs notebook. The models were built using the Tensorflow Keras Deep learning library.
2.6.1 Phase 1: Training Without Transfer Learning\
In this phase of the experimentation process, two separate models were trained. The difference between the first model and the second is that the former uses only a single convolutional layer with 32 filters while the latter uses 2 convolutional layers with 32 and 64 filters. Data augmentation was
applied in both models. A summary of the architecture is shown below.
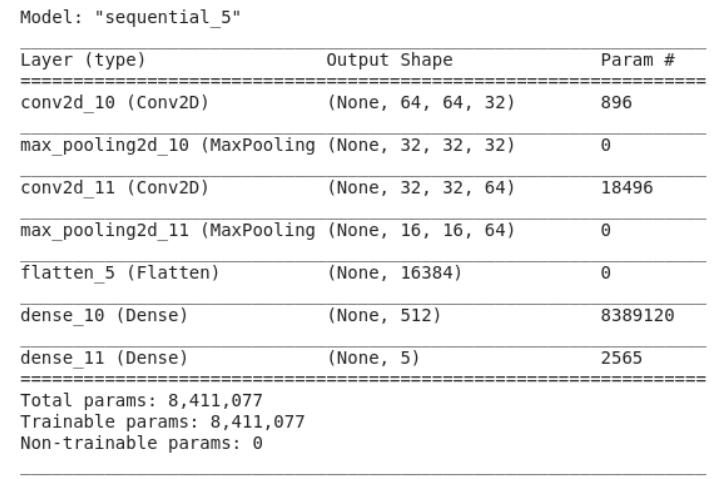
Figure 4: Model Architecture
2.6.2 Phase 2: Training With Transfer Learning.
In this phase, transfer learning was incorporated in the model architecture with data augmentation to improve model accuracy. As mentioned above, the MobileNetV2 was the pre-trained network architecture used for transfer
learning and the results obtained can be seen in the table 1 below.
2.7. Results and Discussions
The WandB (Weights and Biases) python package was used for the logging of the weights and accuracy of the different models during the training phase. It helped in the automatic visualization of the performance of each model
during training. For each model of the different phases, four different graphs were obtained — the training loss, the training accuracy, the validation loss, and the validation accuracy. These graphs are shown below. Also, by implementing the early-stopping technique, the models were trained for only 40 epochs despite the initial 100 epochs set as a hyperparameter. Comparing the results obtained using the 3 different model architectures as seen in the table above, it is evident that there exists some significant variability in the training and validation accuracies. In terms of the training accuracy,
the model that uses MobileNetV2 pre-trained weights outperforms the two simple Deep CNN models with a 92.41% accuracy. However, when it comes to validation accuracy, the CNN model with a single Convolution layer produces
the best model performance with an accuracy of 97.65%.
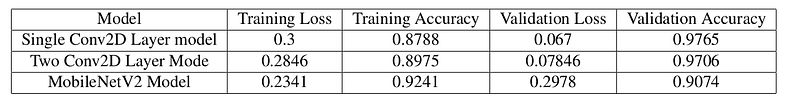
Table 1. Results obtained from the three models represented in the graphs.
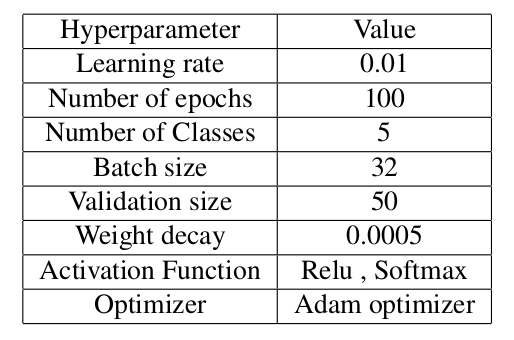
Table 2. Model Parameters
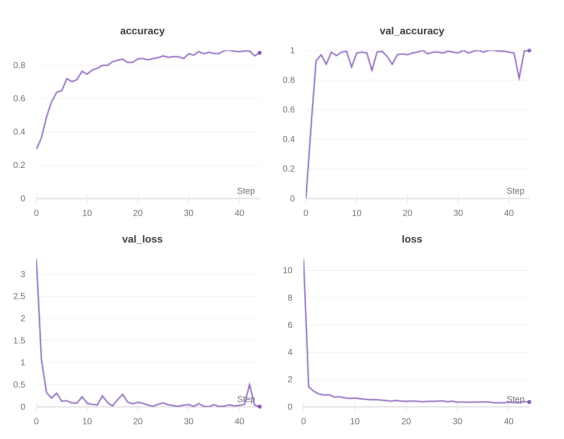
Figure 5: Graph of the model using a single Convolu-
tional layer without Transfer Learning.
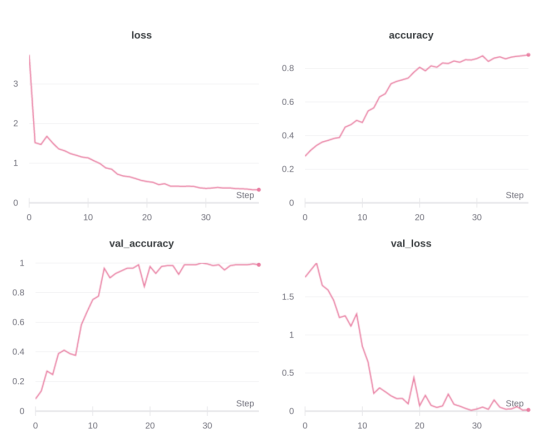
Figure 6: Graph of model using 2 Convolutional layers
without Transfer Learning.
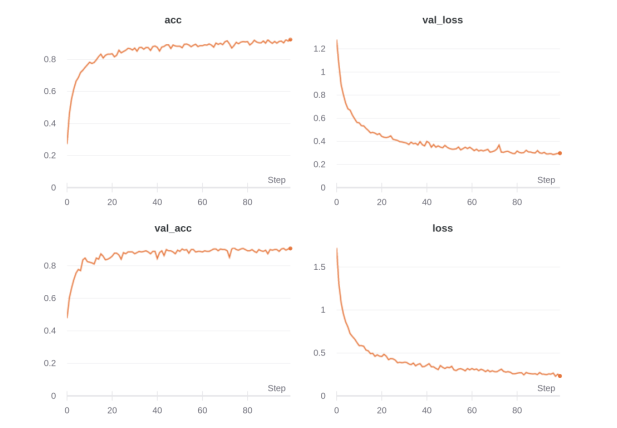
Figure 7: Graph of the model trained with Transfer
Learning.
2.8. Performance Comparison with existing Methods\
By comparing our results with those obtained by the authors in [4] who are the original creators of the dataset and who used a machine learning SVM classifier with different feature extraction techniques, our model is superior. The staggering accuracy of approximately 97.65% obtained using the deep CNN and 92.41% with the transfer learning approach surpassed the 91.11% accuracy the authors of the original paper obtained. This is quite a significant difference given the small dataset of 1350 thermal images used in training. This simply goes to show that, the performance accuracy of our model can be improved even more with a larger dataset.
2.9. Pros and Cons of our Implemented Approach
The deep learning approach implemented in this paper obtains a remarkable performance accuracy of 97.65% using the deep CNN and 92.41% with the transfer learning approach is better than the 91.11% obtained in the original work using SVM classifier. In addition, given the hunger deep learning models have for data, this simply means that our model performance can even obtain higher accuracy if fed with a sufficiently large amount of data. However, our
method had one significant drawback. The training time involved in training the models is substantial as deep learning models have an infamous reputation of high computational time. This drawback can however be sacrificed for higher accuracy. This is because training is often a one time process or spaced out within a very large period of time. Prediction on the other hand is the critical phase detecting server states as it needs to be as fast as possible in order to set in motion fast response from the data center management team. Luckily enough, the prediction of our model is almost instantaneous and therefore serves as the perfect solution for server fault detection and classification.
2.10. Conclusion
In this paper, we implemented a deep CNN method with transfer learning for diagnosing server operation. The method diagnoses the running status of a server by classifying thermal images captured at the outlet of the run-
ning server according to the following states: 60% CPU load (SX), 100% CPU load(OH), the main fan stops running (MF), the CPU fan stops running (CF), and the server entrance is blocked (EB). In general, our implementation had two main bottlenecks. The limited number of thermal images used for training and the high computational time used to train and test three different models. The first two models were simple deep CNN models with no transfer learning and the third was a deep CNN model using pre-trained weights from the MobileNetV2 neural architecture. The classification results obtained show that by using just a simple deep CNN with a single Convolutional layer with data augmentation we get the best validation accuracy of 97.65%. However, the best training accuracy is obtained when we use the model with
MobileNet pre-trained weights where we obtained an accuracy of 92.41%. Hence, we can confidently say that the proposed technique can be used as an intelligent method for diagnosing the operating state of a server, which would inturn help data center managers find hidden faults in servers more accurately and quickly.
2.11. Future Work
The results obtained with our method are quite impressive, however, this be further be improved by building an intelligent system that automatically monitors the states of the servers in the datacenters and at the same time increasing the prediction performance. This can be accomplished by using a concept similar to online learning. By setting up Infrared cameras in large datasets to monitor the states of the servers, these cameras can be made to capture images within a regular time period. Moreover, each time an abnormal state is detected, for example, a fan failure, the image is capture and automatically saved in the appropriate folder.
Then every 4 months or so, the model can be retrained with these augmented images and performance improved. This is the future concept that the paper would further explore.
2.11.1 Acknowledgement\
I want to thank my supervisor Assis. Prof. Hamza Salih
Erden for investing his time to ensuring that this work is a
success. Also, I am entirely grateful to Hang Liu for trusting
us and sharing his private thermal images dataset, without
which this project could have simply been wishful thinking.
Finally, my thanks goes to Prof. Behcet Ugur Toreyin for
offering this amazing course and pushing us to improve our
research skills.
2.12. Link to Project Resources
Dataset Link
Link to Video Presentation
2.13. References\
[1] Federal Energy Management Program, Wireless Sen-
sors Improve Data Center Energy Efficiency, Tech. rep.,U.S. Department of Energy, 2010.
[2] C. Mansley, J. Connell, C. Isci, J. Lenchner, J.O.
Kephart, S. McIntosh, M. Schappert, Robotic mapping and
monitoring of data centers, in: IEEE International Confer-
ence on Robotics and Automation (ICRA), IEEE, 2011, pp.
59055910.
[3] H. Liu, E.K. Lee, D. Pompili, X. Kong, Thermal cam-
era networks for large datacenters using real-time ther-
mal monitoring mechanism, J. Supercomput.64 (2) (2013)
383408.
[4] Hang Liu , Ting Xie, Xianlin Song Wiener Wang,
and Shan Gao; Research on the Intelligent Diagnosis of the
server based on thermal image technology
[5] Hang Liu et al 2017 An Efficient Algorithm for Server
Thermal Fault Diagnosis Based on Infrared Image J. Phys.:
Conf. Ser. 910 012031
[6] Ying-Chieh Chou, L. Yao, Automatic diagnostic sys-
tem of electrical equipment using infrared thermography,
in: International Conference of Soft Computing and Pattern
Recognition, 2009, pp.155160.
[7] Model-Based Thermal Anomaly Detection in Cloud
Datacenters Using Thermal Imaging Eun Kyung Lee, Mem-
ber, IEEE, Hariharasudhan Viswanathan, Member, IEEE,
and Dario Pompili, Senior Member, IEEE
[8]Statistical Feature Extraction to Classify Oral Can-
cers; Anuradha, Dr. K Sankaranarayanan Journal of
Global Research 2013
[9] A Statistical Feature-Based Approach for Operations
Recognition in Drilling Time Series; Bilal Esmael , Arghad
Arnaout, Rudolf K. Fruhwirth and Gerhard Thonhauser
2013 pp 454–461
[10] N. Dalal, B. Triggs, Histograms of Oriented Gradi-
ents for Human Detection vol. 1, (2005) 886893.
[11]Guo Y, Liu Y, Oerlemans A, et al (2016) Deep learn-
ing for visual understanding: A review. Neurocomputing
187:2748. doi: 10.1016/j.neucom.2015.09.116
[12] Ian Goodfellow, Bengio Y, Courville A (2017) Deep
learning. Nat Methods 13:35. doi: 10.1038/nmeth.3707
[13]Lee C-Y, Gallagher PW, Tu Z (2016) Generalizing
pooling functions in convolutional neural networks: Mixed,
gated, and tree. In: Artificial Intelligence and Statistics. pp
464472
[14] Mark Sandler, Andrew Howard, Menglong Zhu, An-
drey Zhmoginov, Liang-Chieh Chen: “Inverted Residuals
and Linear Bottlenecks: Mobile Networks for Classifica-
tion, Detection and Segmentation”, 2018.
[15] Mohd Shawal Jadin, Soib Taib, Kamarul Hawari
Ghazali Feature extraction and classification for detecting
the thermal faults in electrical installations, 2014
Leave a comment